Which Countries Tourists spend the most in the Philippines
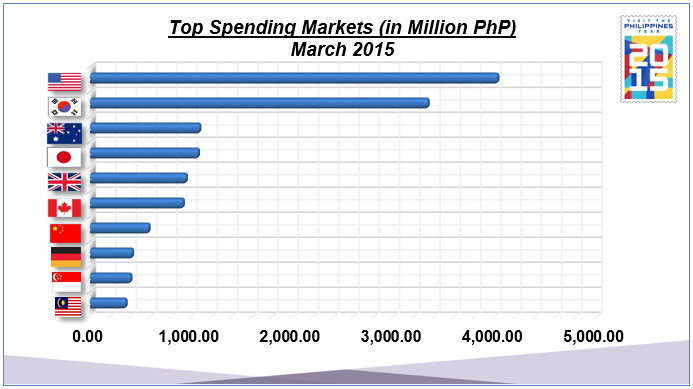
The United States of America moved up as the top tourism spender for March 2015, with Php 4.03 billion, overtaking Korea’s Php 3.34 billion visitor spent.
Australia was 3rd with Php 1.08 billion, while Japan with Php 1.07 billion, and United Kingdom Php 0.95 Billion provided the 4th and 5th biggest visitor receipts for the month in review.
- 4.03 billion United States
- 3.34 billion Korea
- 1.08 billion Australia
- 1.07 billion Japan
- 0.95 billion United Kingdom
Source: http://www.tourism.gov.ph/pages/industryperformance.aspx
Average expenditure for each tourist for the month is stated to be Php 43,956
That covers the spending, but how many Tourists actually arrive.
International Arrivals Jan – March 2015
361,480 Korea
214,057 United States
130,374 Japan
93,043 China
62,899 Australia
46,756 Canada
44,216 Singapore
41,713 Taiwan
40,071 United Kingdom
37,336 Malaysia
Average Spending by person by nationality:
Comparing the two sets of figures we see the following:
214,057 US tourists spent Php 4.03 billion in March 2015 (Est: 13.09b for 3 months) or about 56,480 peso each
361,480 Korean Tourists spent Php 3.34 billion in March 2015 (Est: 10.02b for 3 months) or about 27,719 peso each
An average of Php 43,956 per overall visitor was quoted from the www.tourism.gov.ph webpage.
Department of Tourism (DOT)
According to data from the Department of Tourism (DOT), covering the period from January to October 2013, the following numbers of overseas tourist arrived in that 10 month period of 2013.
- 990,486 South Korea
- 550,991 United States
- 365,905 China
- 360,721 Japan
- 165,282 Australia
- 142,970 Singapore
- 120,587 Taiwan
- 107,312 Hong Kong
- 100,274 Canada
- 96,648 United Kingdom
DOT said a total of 3,867,386 visitors were recorded from January to October 2013, a double-digit gain of 11.19 percent compared to 2012 arrivals of 3,478,285 visitors for the same months. www.abs-cbnnews.com
Comparing the two sets of figures, (although take account of the deferring time period) we see the following:
US tourists spent Php 4.03 billion in ONE MONTH (March 2015)
Korean Tourists spent Php 3.34 billion in ONE MONTH (March 2015)
Multiply that by 10, to get 10 months spending and then divide by the numbers of visitors for the 10 months in the second set of figures, and we get an average spend per person, per nationality, of:
73,141 pesos per person United States
65,343 pesos per person Australia
64,150 pesos per person United Kingdom
33,721 pesos per person South Korea
29,663 pesos per person Japan
These figures seem slightly higher than the March 2015 figures shown at the top.
The accuracy of this is only right of the numbers of visitors per country stayed in the same proportion. As soon as I can find accurate visitor numbers for March 2015, I will redo that calculation, for a more accurate result.
It also takes no account of length of time each visitor stays. For example an Australian spends twice as much as a South Korean, but may also stay in the Philippines twice as long, meaning they could each spend a similar figure per day.
However, taking that one example further, I have heard that many Koreans spend much shorter time here, than the average Australian, so it could be be closer to say that the average Korean may spend twice as much as the Australian, for each day in the country.